| Market Closed - Japan Exchange 09:30:02 02/07/2026 +03 | 5-day change | 1st Jan Change | ||
| 4,014.98 PTS | +0.09% |
|
-0.04% | +17.78% |
| 06-26 | Tech Caution Overcomes Asian Stock Markets | MT |
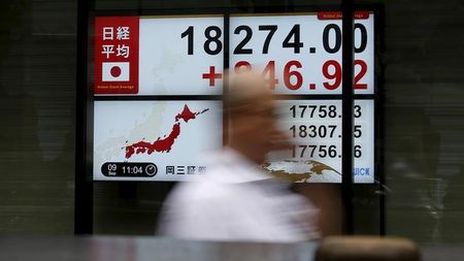
| 06-26 | Japan's Nikkei ends 4% lower as SoftBank tanks on OpenAI IPO delay report | RE |
Quotes 5-day view: TOPIX Index
Delayed Quote Japan Exchange
| 25/06/2026 | 26/06/2026 | 29/06/2026 | 30/06/2026 | 01/07/2026 | |
|---|---|---|---|---|---|
| Last | 4,016.47 | 3,963.36 | 3,982.00 | 3,994.76 | 4,011.50 |
| Volume | 2,575,678,900 | 2,551,884,500 | 2,876,044,200 | 2,548,193,400 | 2,489,942,200 |
| Change | +1.33% | -1.32% | +0.47% | +0.32% | +0.42% |
| Opening | 4,001.59 | 4,001.48 | 3,976.82 | 3,999.16 | 4,019.65 |
| High | 4,032.66 | 4,016.25 | 3,995.57 | 4,020.32 | 4,050.33 |
| Low | 3,987.08 | 3,931.13 | 3,940.45 | 3,972.49 | 3,998.13 |
Performance
| 1 week | -0.04% | ||
| Current month | +0.51% | ||
| 1 month | +2.31% | ||
| 3 months | +11.17% | ||
| 6 months | +17.78% | ||
| Current year | +17.78% | ||
| 1 year | +42.07% | ||
| 3 years | +75.43% | ||
| 5 years | +105.23% | ||
| 10 years | +220.06% |
Indicators
Moving average 5 days
3,993.62
Moving average 20 days
3,967.19
Moving average 50 days
3,891.49
Moving average 100 days
3,801.44
Price spread / (MMA5)
-0.53%
Price spread / (MMA20)
-1.19%
Price spread / (MMA50)
-3.08%
Price spread / (MMA100)
-5.32%
RSI 9 days
55.18
RSI 14 days
55.49
Historical Quotes: TOPIX Index
| Date | Opening | High | Low | Close | Volume | Change |
|---|
Headlines


Highest TOPIX Index increases |
|
|---|---|
|
|
+10.82% |
|
|
+10.68% |
|
|
+9.95% |
|
|
+8.84% |
|
|
+8.72% |
The sharpest declines in TOPIX Index. |
|
|---|---|
|
|
-9.96% |
|
|
-10.00% |
|
|
-11.23% |
|
|
-11.29% |
|
|
-11.38% |
Course Extremes
| 1 week | 3,931.13 | 4,052.98 | |
| 1 month | 3,766 | 4,103.76 | |
| 3 years | 2,196.95 | 4,103.76 | |
| 5 years | 1,755.14 | 4,103.76 | |
| 10 years | 1,199.25 | 4,103.76 |
Monthly variations
Annual variations
| 2026 | +17.78% | ||
| 2025 | +22.41% | ||
| 2024 | +17.69% | ||
| 2023 | +25.09% | ||
| 2022 | -5.05% | ||
| 2021 | +10.40% | ||
| 2020 | +4.84% | ||
| 2019 | +15.21% | ||
| 2018 | -17.80% | ||
| 2017 | +19.69% | ||
| 2016 | -1.85% | ||
| 2015 | +9.93% | ||
| 2014 | +8.08% | ||
| 2013 | +51.46% | ||
| 2012 | +18.01% | ||
| 2011 | -18.94% | ||
| 2010 | -0.97% | ||
| 2009 | +5.63% | ||
| 2008 | -41.77% | ||
| 2007 | -12.22% | ||
| 2006 | +1.90% | ||
| 2005 | +43.50% | ||
| 2004 | +10.15% | ||
| 2003 | +23.76% | ||
| 2002 | -18.30% | ||
| 2001 | -19.59% | ||
| 2000 | -25.46% | ||
| 1999 | +58.44% | ||
| 1998 | -7.49% | ||
| 1997 | -20.12% | ||
| 1996 | -6.77% | ||
| 1995 | +1.19% | ||
| 1994 | +8.32% |
- Stock Market
- Indices
- TOPIX Index
- Quotes TOPIX Index
Select your edition
All financial news and data tailored to specific country editions


